Style Cards and Layout
A figure's style selects a style card — a JSON file that fixes the figure size, the exact
position of every axis, the fonts, ticks, and the per-method default styling. You reference a
card by [family, variant]:
Figures:
  - name: my_figure
    style: [a4paper_2x1, rectcmap]    # family, variant
Picking a card is all most users need. This page explains what a card contains and how to read its dimensions — and the design-reference debug mode that draws those dimensions onto the figure.
Each style is a JSON card
The token [family, variant] resolves to a JSON file under the Jarvis-PLOT package
(jarvisplot/cards/<family>/<variant>.json). A card has two top-level blocks:
{
  "Frame": { "figure": { "figsize": [3.3, 2.75] },
             "axes":   { "ax": {"rect": [0.142, 0.168, 0.68, 0.775]},
                         "axc": {"rect": [0.827, 0.182, 0.036, 0.746]},
                         "axlogo": {"rect": [0.01, 0.01, 0.06, 0.072]} },
             "ax":  { "...frame / grid / ticks / labels..." },
             "axc": { "...colorbar styling..." } },
  "Style": { "scatter": {"...defaults..."}, "voronoi": {"..."} }
}
| Block | Owns |
|---|---|
Frame.figure.figsize |
Figure size in inches [width, height] |
Frame.axes.<id>.rect |
Each axis box as [left, bottom, width, height] in figure fractions |
Frame.ax / Frame.axc / Frame.axtri |
Default frame, grid, ticks and labels for those axes |
Style.<method> |
Default keyword args for each plot method |
Your figure's frame and per-layer style are deep-merged over these card defaults, so you
only override what you need — see Frame and Figures and Layers.
Reading the dimensions
Each axis box is stored as a fraction of the figure, and the figure size is in inches. To get centimetres:
size_cm = fraction × figsize_inch × 2.54
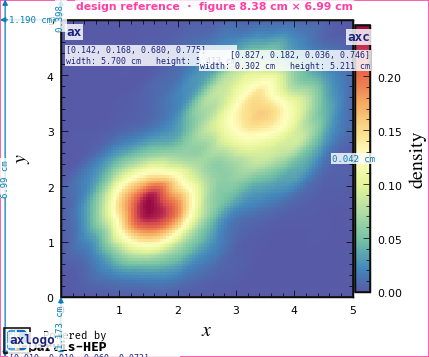
For example, with figsize: [3.3, 2.75] (= 8.38 cm × 6.99 cm) and ax.rect = [0.142, 0.168, 0.68, 0.775]:
- main-axes width =
0.68 × 3.3 × 2.54≈ 5.70 cm - main-axes height =
0.775 × 2.75 × 2.54≈ 5.41 cm - left margin =
0.142 × 3.3 × 2.54≈ 1.19 cm
You rarely compute these by hand — the debug mode draws them for you.
Axis ids
The axis ids a card provides are exactly the keys layers target with axes: and colorbars
attach to with colorbar:.
| Id | Purpose |
|---|---|
ax |
Main rectangular axes |
axc |
Colorbar axes (present in *cmap variants) |
axtri |
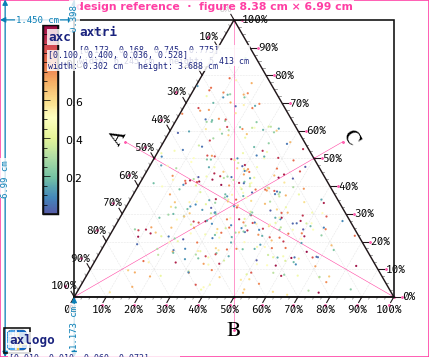
Ternary axes (present in Ternary* variants) |
axlogo |
The "Powered by Jarvis-HEP" logo inset (hidden with --print) |
ax0, ax1, … |
Panels in multi-panel cards |
Families and variants
| Family | Variants | Layout |
|---|---|---|
a4paper_2x1 |
rect, rectcmap, Ternary, TernaryCmap, rect_5x1, dynesty_runplot |
A4, 2 columns × 1 row |
a4paper_4x1 |
rect, rectcmap, Ternary, TernaryCmap |
A4, 4 columns × 1 row |
a4paper_1x1 |
Ternary |
A4, single panel |
gambit_2x1 |
rectcmap, Ternary, TernaryCmap |
GAMBIT collaboration style |
gambit_1x1 |
Ternary |
GAMBIT single panel |
Design-reference debug mode
Set debug: true on a figure to render a dimension overlay on top of the finished plot.
Every axis defined by the card is outlined and annotated with its name, its
rect = [left, bottom, width, height], and its width/height in centimetres; the primary axes
also gets margin dimension lines, and the colorbar gets a gap dimension.
Figures:
  - name: my_figure
    debug: true                        # ← draw the design-reference overlay
    style: [a4paper_2x1, rectcmap]
    frame: { ... }
    layers: [ ... ]
A rectangular card with a colorbar:
A ternary card:
What the overlay shows:
- pink border + caption — the figure outline and its size in cm (from
figure.figsize) - black boxes — each axis at its
rectposition - navy text — the axis id, its
[left, bottom, width, height], and its cm size - blue dimension lines — the figure height, the primary axes' left/top/bottom margins, and the gap to the colorbar
The overlay is purely an annotation layer added just before saving — it never alters the data
plot, and it is only drawn when debug: true. Use it to read off the numbers you would put into
a custom card, or to verify a frame override moved an axis where you expected.
See also: Figures and Layers · Frame: Axes and Colorbar · Figure Gallery